Use Hop Nodes on Oracle Linux Automation Manager
Introduction
Oracle Linux Automation Manager supports a service mesh technology based on the upstream receptor project. The service mesh links controller, hop, and execution nodes into an overlay network through a daemon-based receptor application.
Oracle Linux Automation Manager introduces the hop node as part of the service mesh. This node type allows tasks to be relayed from control plane nodes to execution nodes on remote or restricted networks in the same way SSH uses a jump host. This implementation enables jobs to run across different execution nodes and move tasks closer to the systems that need automation.
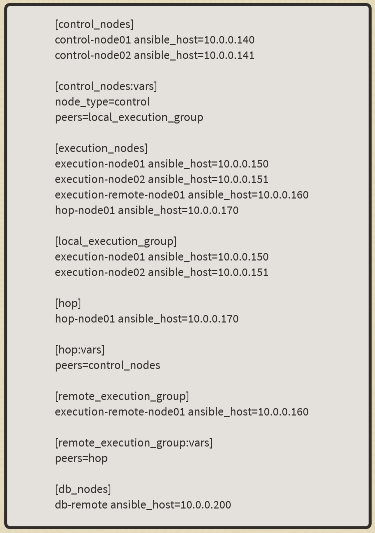
The sample inventory below defines a multi-node cluster deployment in the free lab environment. To help automate the cluster installation on your hardware, check out the playbook in the Oracle Linux Automation Manager section of the ansible-playbooks project.
This sample inventory creates a cluster consisting of two control plane nodes, two execution nodes, a hop node with a single remote execution node, and a remote database.
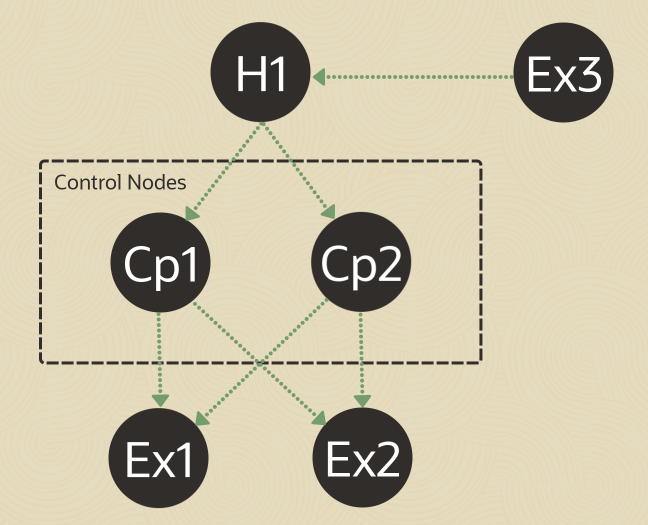
This image shows the service mesh topology for this cluster.
This tutorial shows several methods to check the status of a service mesh and confirm the topology communication between the various nodes.
Objectives
In this tutorial, you'll learn how to:
- List the capacity of the control plane and execution nodes
- View the service mesh status for a given cluster node
- View the service mesh status using an API call
Prerequisites
- A cluster with Oracle Linux Automation Manager installed and Service Mesh configured
- An Oracle Cloud Infrastructure (OCI) account
- A user in the OCI account with permission to work with resources in a compartment
- Access to that account's credentials and OCID information
For details on installing Oracle Linux Automation Manager, see the Oracle Linux Automation Manager Installation Guide .
Deploy Oracle Linux Automation Manager Instances
Note: If running in your own tenancy, read the linux-virt-labs GitHub project README.md and complete the prerequisites before deploying the lab environment.
Open a terminal on the Luna Desktop.
Clone the
linux-virt-labsGitHub project.git clone https://github.com/oracle-devrel/linux-virt-labs.gitChange into the working directory.
cd linux-virt-labs/olamInstall the required collections.
ansible-galaxy collection install -r requirements.ymlUpdate the Oracle Linux instance configuration.
cat << EOF | tee instances.yml > /dev/null
compute_instances:
  1:
    instance_name: "olam-control-01"
    type: "control"
  2:
    instance_name: "olam-control-02"
    type: "control"
  3:
    instance_name: "olam-execution-01"
    type: "execution"
  4:
    instance_name: "olam-execution-02"
    type: "execution"
  5:
    instance_name: "olam-remote-execution-01"
    type: "execution"
  6:
    instance_name: "olam-hop-01"
    type: "execution"
  7:
    instance_name: "olam-db"
    type: "db"
passwordless_ssh: true
olam_type: none
add_cluster_ports: true
EOF
Create an inventory file.
cat << EOF | tee hosts > /dev/null
localhost ansible_connection=local ansible_connection=local ansible_python_interpreter=/usr/bin/python3.6
EOF
Deploy the lab environment.
ansible-playbook create_instance.yml -i hosts -e "@instances.yml"The free lab environment requires the extra variable
ansible_python_interpreterfor localhost because it installs the RPM package for the Oracle Cloud Infrastructure SDK for Python. The location for installing this package is under the system's default Python modules based on your version of Oracle Linux. Using an inventory variable avoids impacting the plays running on hosts other than localhost.The default deployment shape uses the AMD CPU. You can change the shape of the instances by passing a new shape variable definition on the command line.
For example:
-e instance_shape="VM.Standard3.Flex"Similarly, the default version of the Oracle Linux image uses the variable
os_versiondefined in the `default_vars.yml file. You can modify this value by passing the Oracle Linux major version on the command line.For example:
-e os_version="9"Important: Wait for the playbook to run successfully and reach the pause task. At this stage of the playbook, the installation of Oracle Linux is complete, and the instances are ready. Note the previous play, which prints the public and private IP addresses of the nodes it deploys.
Deploy the Oracle Linux Automation Manager Cluster
Open a new terminal.
Ensure you are in the olam directory of the linux-virt-labs project.
Convert the basic inventory file.
This conversion script creates a cluster-compatible inventory file from the basic inventory generated by the instance deployment playbook.
chmod +x convert_ansible_inventory.sh
./convert_ansible_inventory.sh hosts > hosts.cluster
Run the cluster deployment playbook.
ansible-playbook -i hosts.cluster deploy_olam_cluster.yml"
Log into the WebUI
Open a terminal and configure an SSH tunnel to the olam-control-01 instance of the Oracle Linux Automation Manager cluster.
ssh -L 8444:localhost:443 oracle@<hostname_or_ip_address>Open a web browser and enter the URL.
https://localhost:8444Note: Approve the security warning based on the browser used. Click the **Advanced button for Chrome and then the Proceed to localhost (unsafe) link.
Login to Oracle Linux Automation Manager with the USERNAME
adminand the PASSWORDadmincreated during the automated deployment.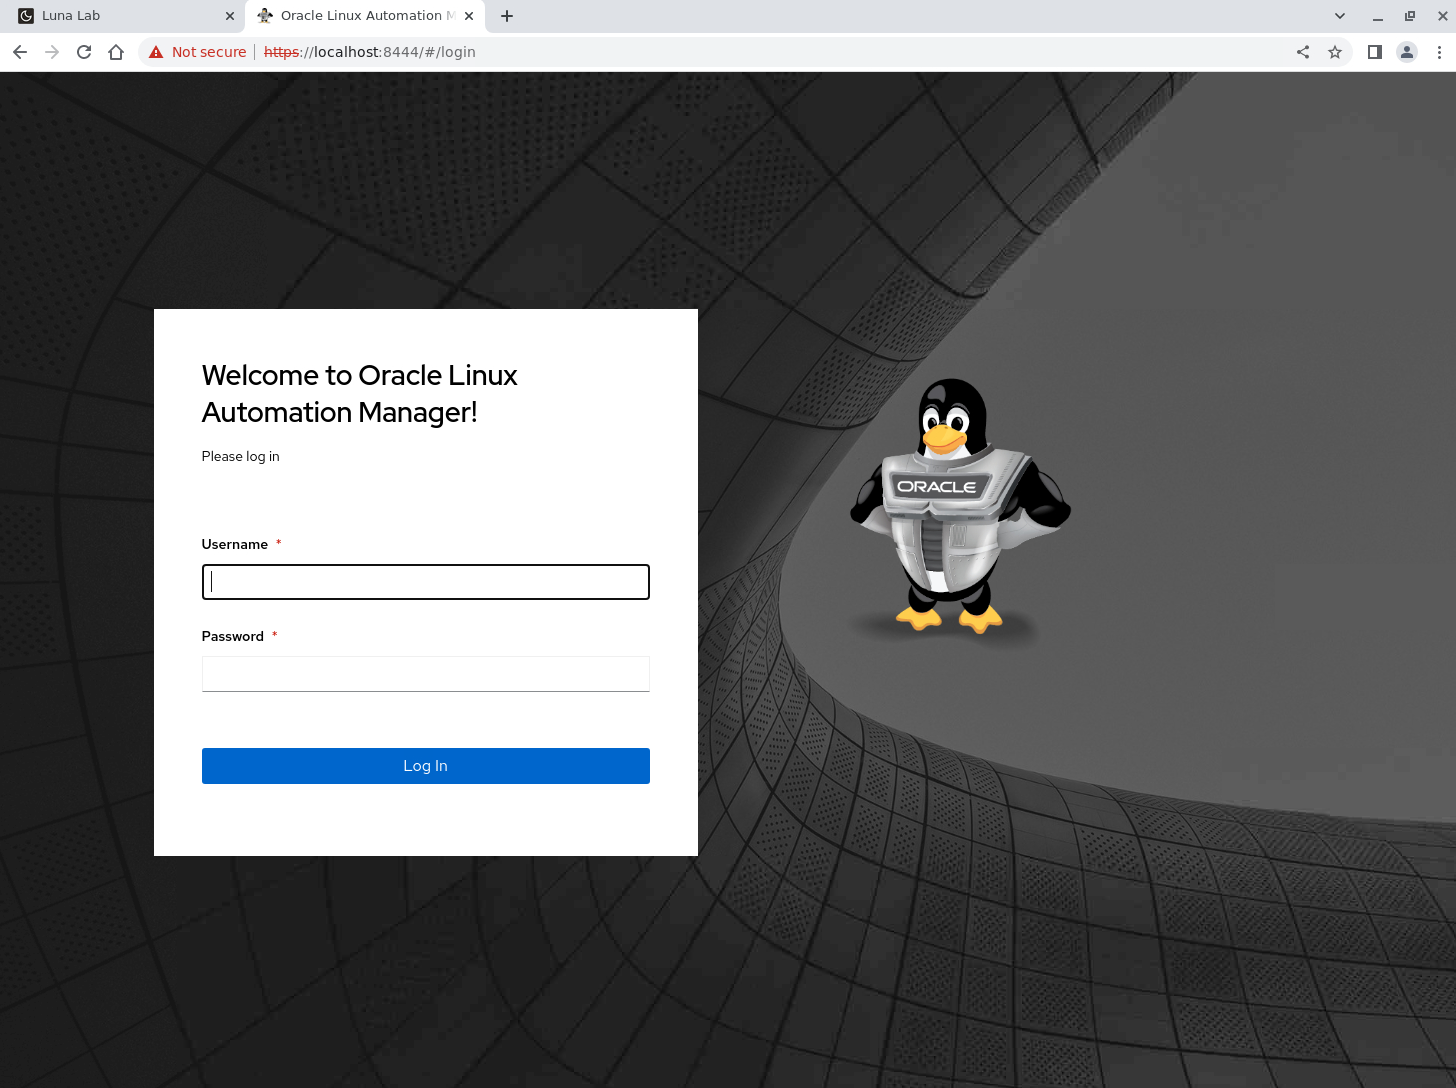
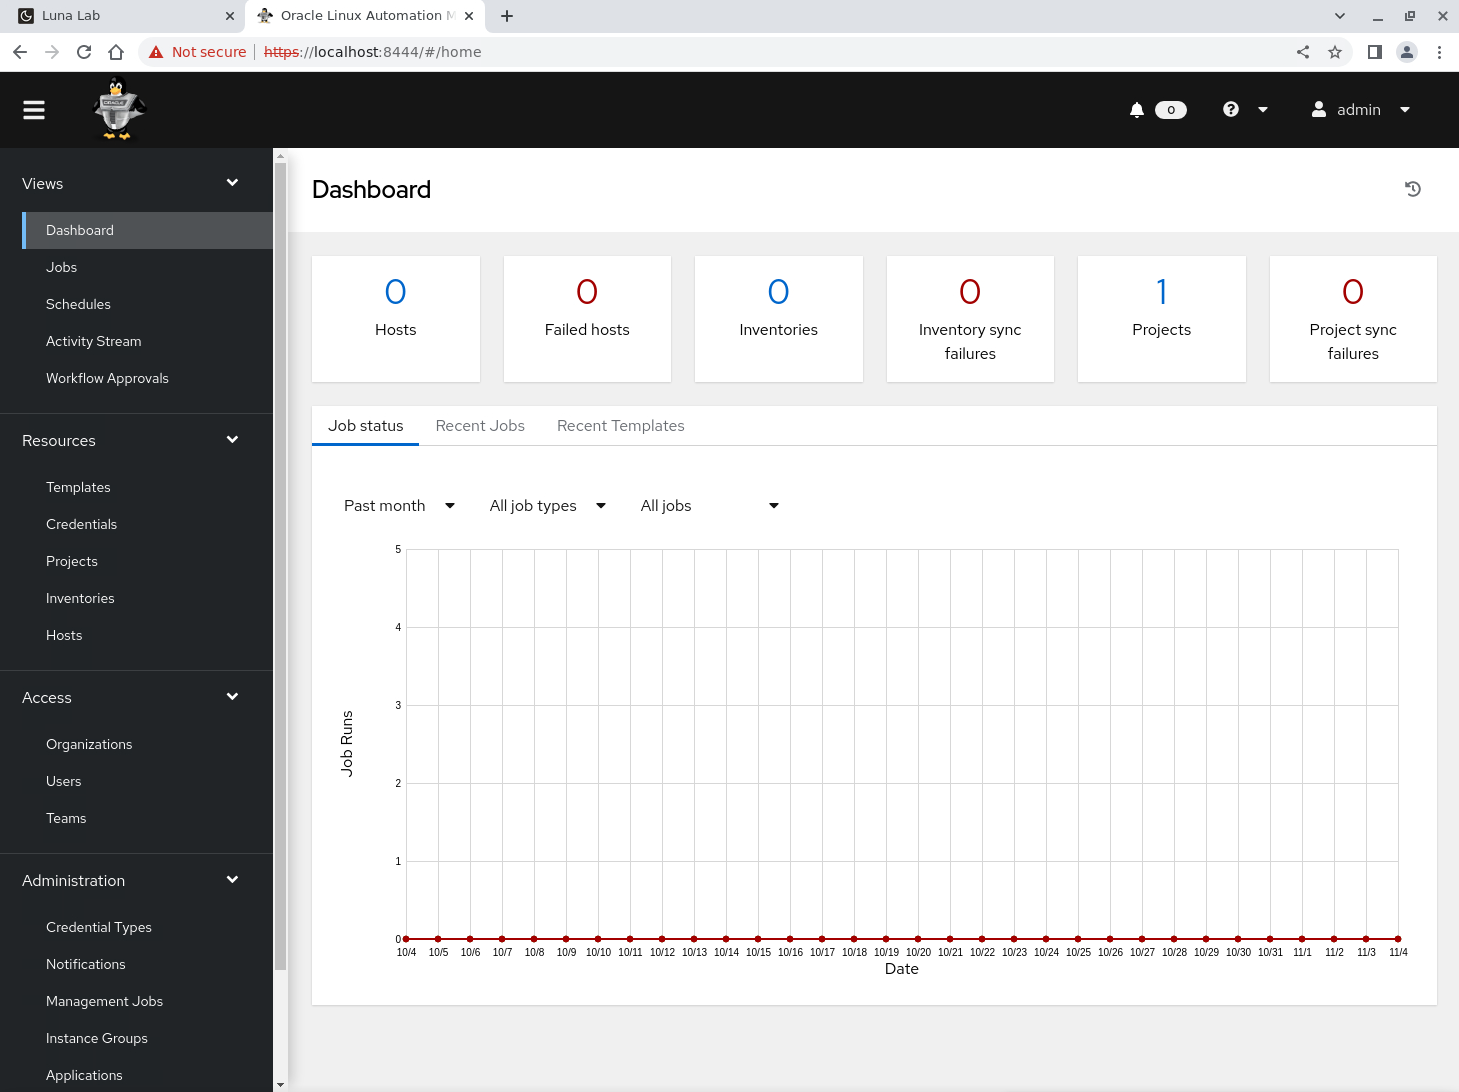
After login, the WebUI displays.
Confirm Instance Groups in the WebUI
An Instance Group allows for grouping instances within a cluster based on policies. These policies determine the instance group behavior and execution of which jobs.
Click Instance Groups under Administration in the navigation menu.
Review the Instance Groups page.
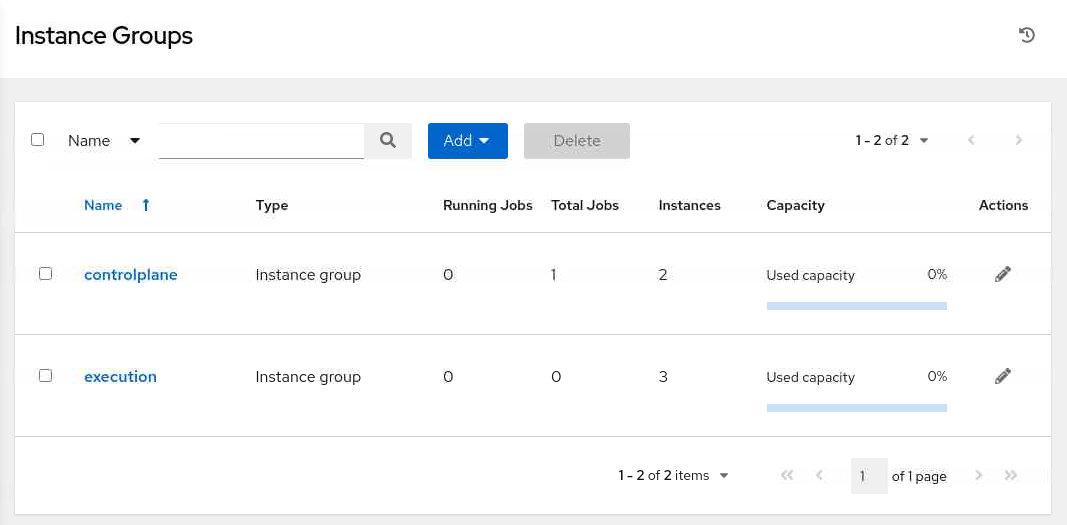
The page shows the capacity based on policy settings. See the Managing Instance Groups under the Setting Up Resources chapter of the Oracle Linux Automation Manager User's Guide documentation for more details on these policy settings.
Visualize the Cluster Topology
Click Topology View under the Administration section in the navigation menu.
Review the Topology View page.
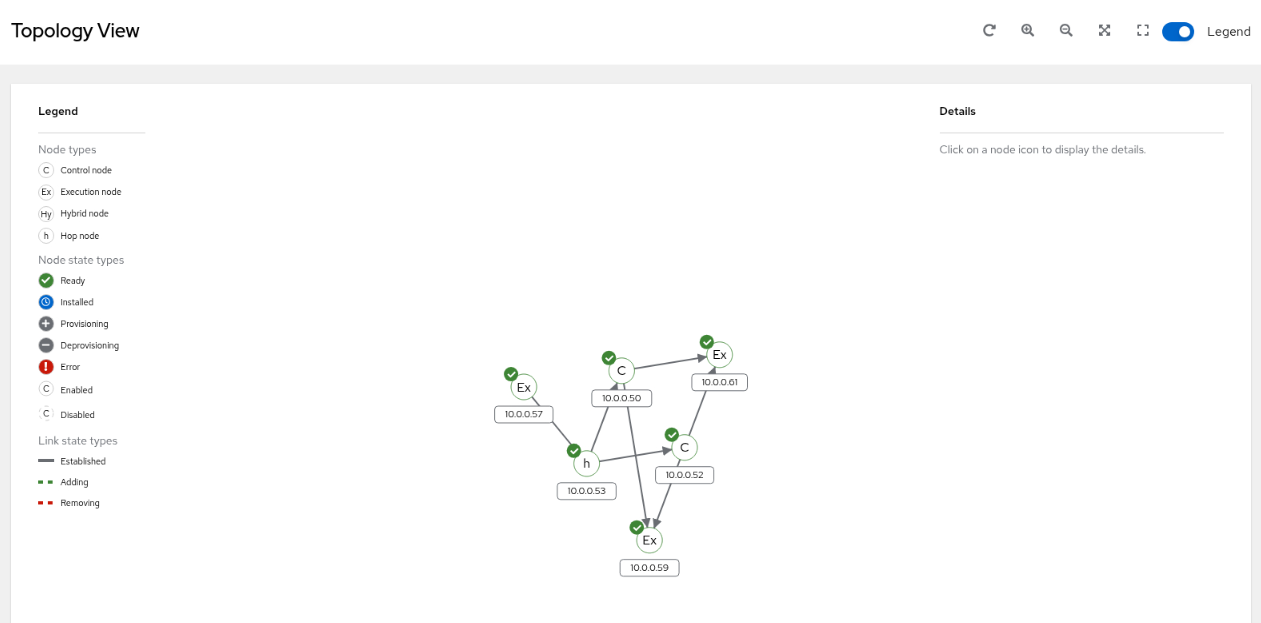
The page shows a graphical layout of the cluster's topology containing each of its nodes. Rolling over the nodes shows arrows from one node to another, indicating their peer association.
List Instances
Using the awx-manage utility, an administrator can configure and list instances associated with the instance groups (queues). An administrator performs this action from any of the control plane nodes within the cluster.
Switch to the terminal window connected to the olam-control-01 instance.
Log into the Oracle Linux Automation Manager user account.
sudo su -l awx -s /bin/bashList the instances.
awx-manage list_instancesExample Output:
[awx@olam-control-01 ~]$ awx-manage list_instances
[controlplane capacity=594]
	10.0.0.56 capacity=297 node_type=control version=24.6.1 heartbeat="2025-07-14 21:46:33"
	10.0.0.62 capacity=297 node_type=control version=24.6.1 heartbeat="2025-07-14 21:46:33"

[execution capacity=891]
	10.0.0.54 capacity=297 node_type=execution version=24.6.1 heartbeat="2025-07-14 21:46:33"
	10.0.0.55 capacity=297 node_type=execution version=24.6.1 heartbeat="2025-07-14 21:46:33"
	10.0.0.59 capacity=297 node_type=execution version=24.6.1 heartbeat="2025-07-14 21:46:37"

[ungrouped capacity=0]
	10.0.0.50 node_type=hop heartbeat="2025-07-14 21:46:10"
The output shows the
controlplaneandexecutionqueues and each associated node. Hop nodes appear in theungroupedqueue as they are not associated with an active queue containing capacity.Disconnect from the Oracle Linux Automation Manager user.
exitThis action should return you to the oracle user account on the olam-control-01 instance.
Show the Service Mesh Status
With the service mesh running, getting the status of the service mesh and the associated nodes is possible.
Get the status of the service mesh.
sudo receptorctl --socket /var/run/receptor/receptor.sock statusExample Output:
[oracle@olam-control-01 ~]$ sudo receptorctl  --socket /var/run/receptor/receptor.sock status
Node ID: 10.0.0.56
Version: 1.4.4
System CPU Count: 4
System Memory MiB: 31804

Connection   Cost
10.0.0.50    1
10.0.0.62    1
10.0.0.55    1
10.0.0.54    1

Known Node   Known Connections
10.0.0.50    10.0.0.56: 1 10.0.0.59: 1 10.0.0.62: 1
10.0.0.54    10.0.0.56: 1 10.0.0.62: 1
10.0.0.55    10.0.0.56: 1 10.0.0.62: 1
10.0.0.56    10.0.0.50: 1 10.0.0.54: 1 10.0.0.55: 1 10.0.0.62: 1
10.0.0.59    10.0.0.50: 1
10.0.0.62    10.0.0.50: 1 10.0.0.54: 1 10.0.0.55: 1 10.0.0.56: 1

Route        Via
10.0.0.50    10.0.0.50
10.0.0.54    10.0.0.54
10.0.0.55    10.0.0.55
10.0.0.59    10.0.0.50
10.0.0.62    10.0.0.62

Node         Service   Type       Last Seen             Tags
10.0.0.55    control   Stream     2025-07-14 21:48:10   {'type': 'Control Service'}
10.0.0.54    control   Stream     2025-07-14 21:48:10   {'type': 'Control Service'}
10.0.0.50    control   Stream     2025-07-14 21:48:10   {'type': 'Control Service'}
10.0.0.59    control   Stream     2025-07-14 21:48:13   {'type': 'Control Service'}
10.0.0.56    control   Stream     2025-07-14 21:48:31   {'type': 'Control Service'}
10.0.0.62    control   Stream     2025-07-14 21:48:10   {'type': 'Control Service'}

Node         Work Types
10.0.0.55    ansible-runner
10.0.0.54    ansible-runner
10.0.0.50    local
10.0.0.59    ansible-runner
10.0.0.56    local
10.0.0.62    local
The
receptorctlcommand is the front-end CLI that interacts with the service mesh over its control socket interface. Passing--helpto thereceptorctlcommand shows the CLI options and different commands.Run a traceroute from the control plane node to the remote execution node.
sudo receptorctl --socket /var/run/receptor/receptor.sock traceroute $(ssh olam-remote-execution-01 hostname -i)Example Output:
[oracle@olam-control-01 ~]$ sudo receptorctl  --socket /var/run/receptor/receptor.sock traceroute $(ssh olam-remote-execution-01 hostname -i)
0: 10.0.0.56 in 282.074µs
1: 10.0.0.50 in 817.948µs
2: 10.0.0.59 in 817.226µs
Note: If you see special characters in the output that fail to render, switch the encoding in the terminal window to UTF-8 by clicking Terminal > Set Encoding > Unicode in the menu.
In the above example, the route starts on the first control plane node, passes through the hop node, and lands on the remote execution node.
Check the Service Mesh Status in the WebUI
The Oracle Linux Automation Manager API uses a rest api call that allows an administrator to view the status information about each node in the service mesh cluster.
Switch to a browser window in the free lab environment and enter the URL.
https://localhost:8444/api/login/Note: Approve the security warning based on the browser used. Click the Advanced button for Chrome and then the Proceed to localhost (unsafe) link.
Log in to the Oracle Linux Automation Manager REST API. Use the Username
adminand the Passwordadmincreated during the automated deployment.
The REST API displays after a successful login.
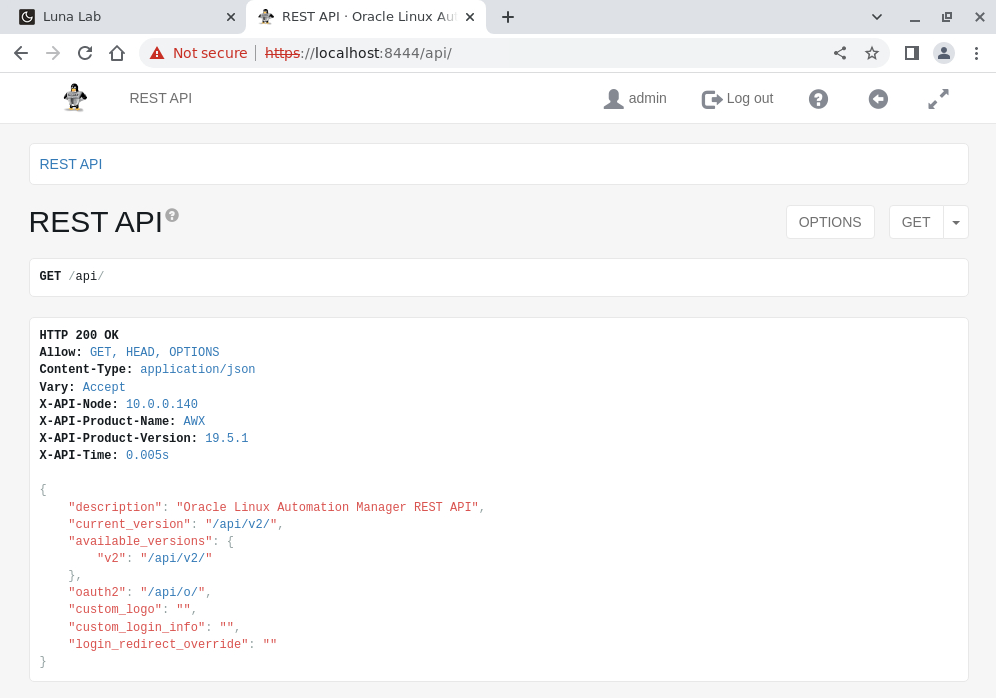
Click one of the /api/v2/ hyperlinks from the response area.
The click performs a GET request and displays all the available API resources.
Scroll to the bottom and click the mesh_visualizer link.
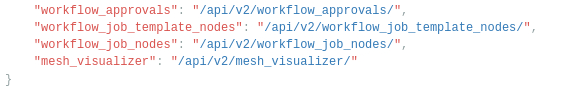
Look through the output.
Notice the different nodes and their specific node_type. The links section shows how each node associates with one another in the service mesh.
Next Steps
The various outputs show a running cluster with hop and execution nodes for running playbooks using Oracle Linux Automation Manager. Now, go and run a few playbooks and get additional practice by checking out our other tutorials on the Oracle Linux Training Station.
Related Links
Oracle Linux Automation Manager Documentation
Oracle Linux Automation Manager Training
Oracle Linux Training Station