Analyze Sample Logs with OCI Logging Analytics
Introduction
A typical enterprise environment has massive amounts of log telemetry. Finding interesting log data and events and correlating them to a specific business flow from across all your applications, or identifying abnormal behavior can be challenging. OCI Logging Analytics is a cloud solution that aggregates, indexes, and analyzes a variety of log data from on-premises and multicloud environments. It enables you to search, explore, and correlate this data, derive operational insights and make informed decisions. Logging Analytics can ingest, analyze and correlate logs from virtually any source. Correlation activities leverage both out-of-the-box applied machine learning as well as a sophisticated query language.
In this tutorial, learn how to use OCI Logging Analytics in a pre-configured environment to easily perform such tasks, including outlier detection, event clustering, log correlation and anomaly detection.
Objectives
Learn how to troubleshoot issues by analyzing log files leveraging pre-built machine learning algorithms, in-context and interactive dashboards to quickly pin-point problems and identify root-causes using OCI Logging Analytics.
Prerequisites
Before You Begin
Once you launch the lab, you are presented with your very own Desktop. You will use a browser to login to an Oracle Cloud Infrastructure environment designed and configured to run specific Logging Analytics tasks.
You will log in as an OCI Administrator user and perform the lab steps within a single region.
Login to the OCI Environment
If you have not yet done so, navigate to your Desktop, open the Luna-Lab.html file by double-clicking on the file. If a dialog box appears, check that Chrome is checked as the default browser and uncheck the sending of statistics and crash reports to Google.
Note the details in this file, scrolling down to view them all: a Quick Link to OCI, your username and password, and other lab details. Click on the OCI CONSOLE button. The OCI Login interface opens up in a separate tab. Click on the OCI Console button and an OCI Console login appears in a new browser tab. If a message appears regarding cookies on the site, click the I accept all cookies button.
Navigate to first tab, copy your username and paste it in the User Name field in the second tab.
Repeat Step 3 above, this time copy the Password, then click Sign In. Save the password if you'd like and ignore any other messages that may pop up.
In the upper left side of the OCI Console click the navigation icon, click Observability & Management, navigate to Logging Analytics, then click Log Explorer.
In the time window (top right) select Last 14 Days.
Note that your environment may have more logs than shown here and your analysis charts may show different numbers. The pre-built environments are enhanced periodically. However, the exploration steps remain the same.
You are now ready to explore Logging Analytics!
Explore Logs Using Clustering
On the chart, click on OCI VCN Flow Logs to drill down into VCN flow data.
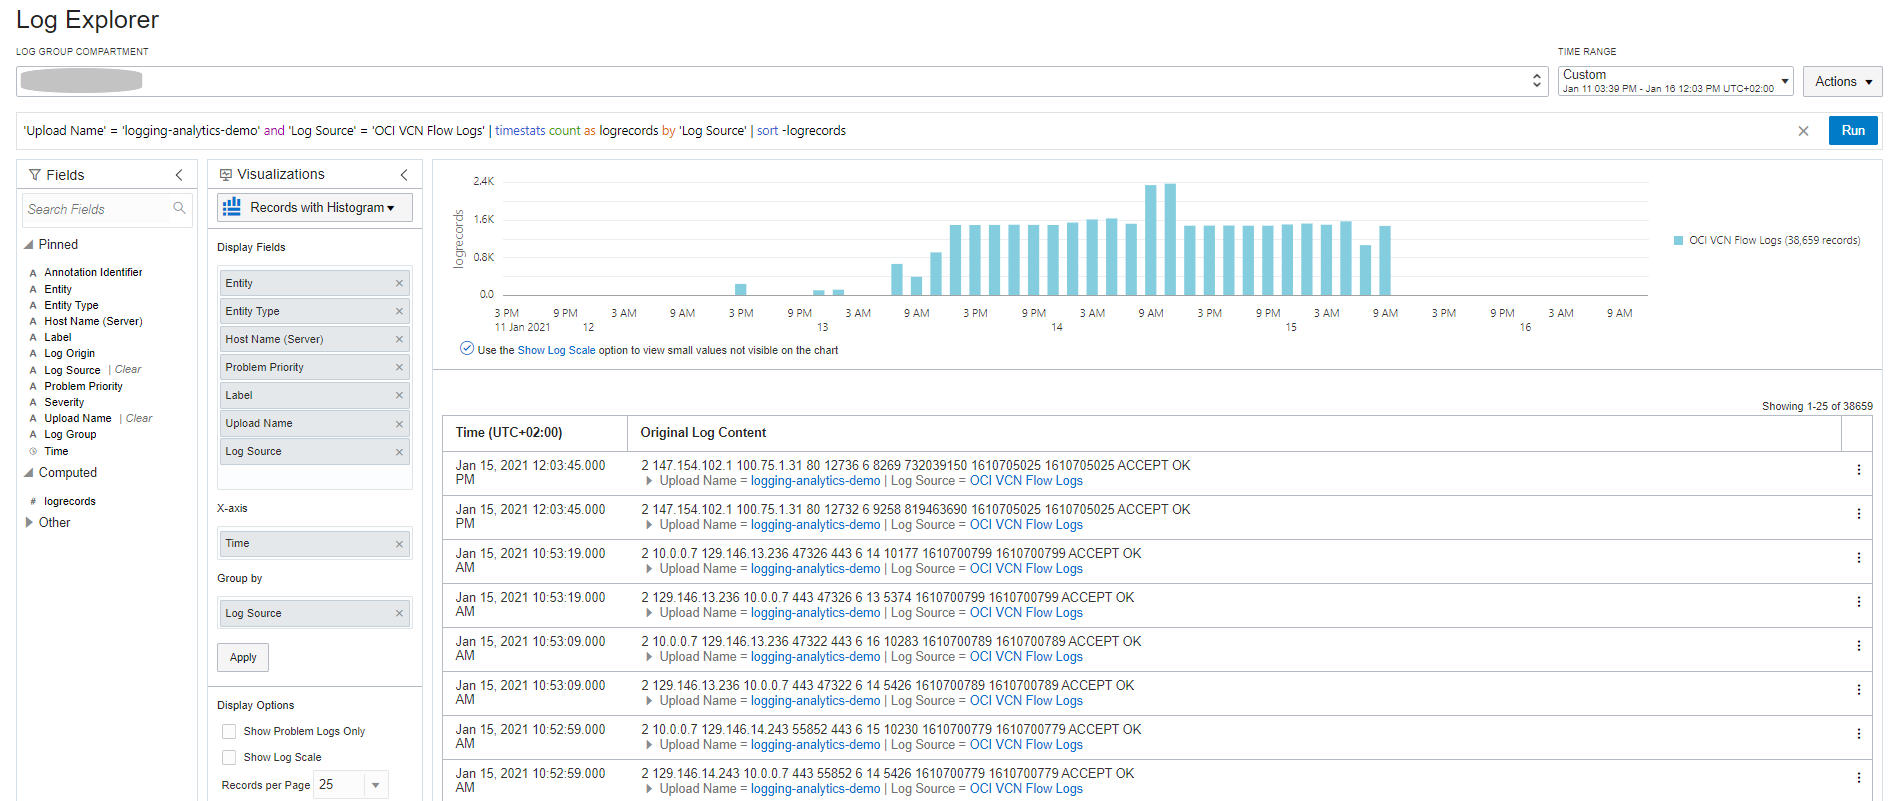
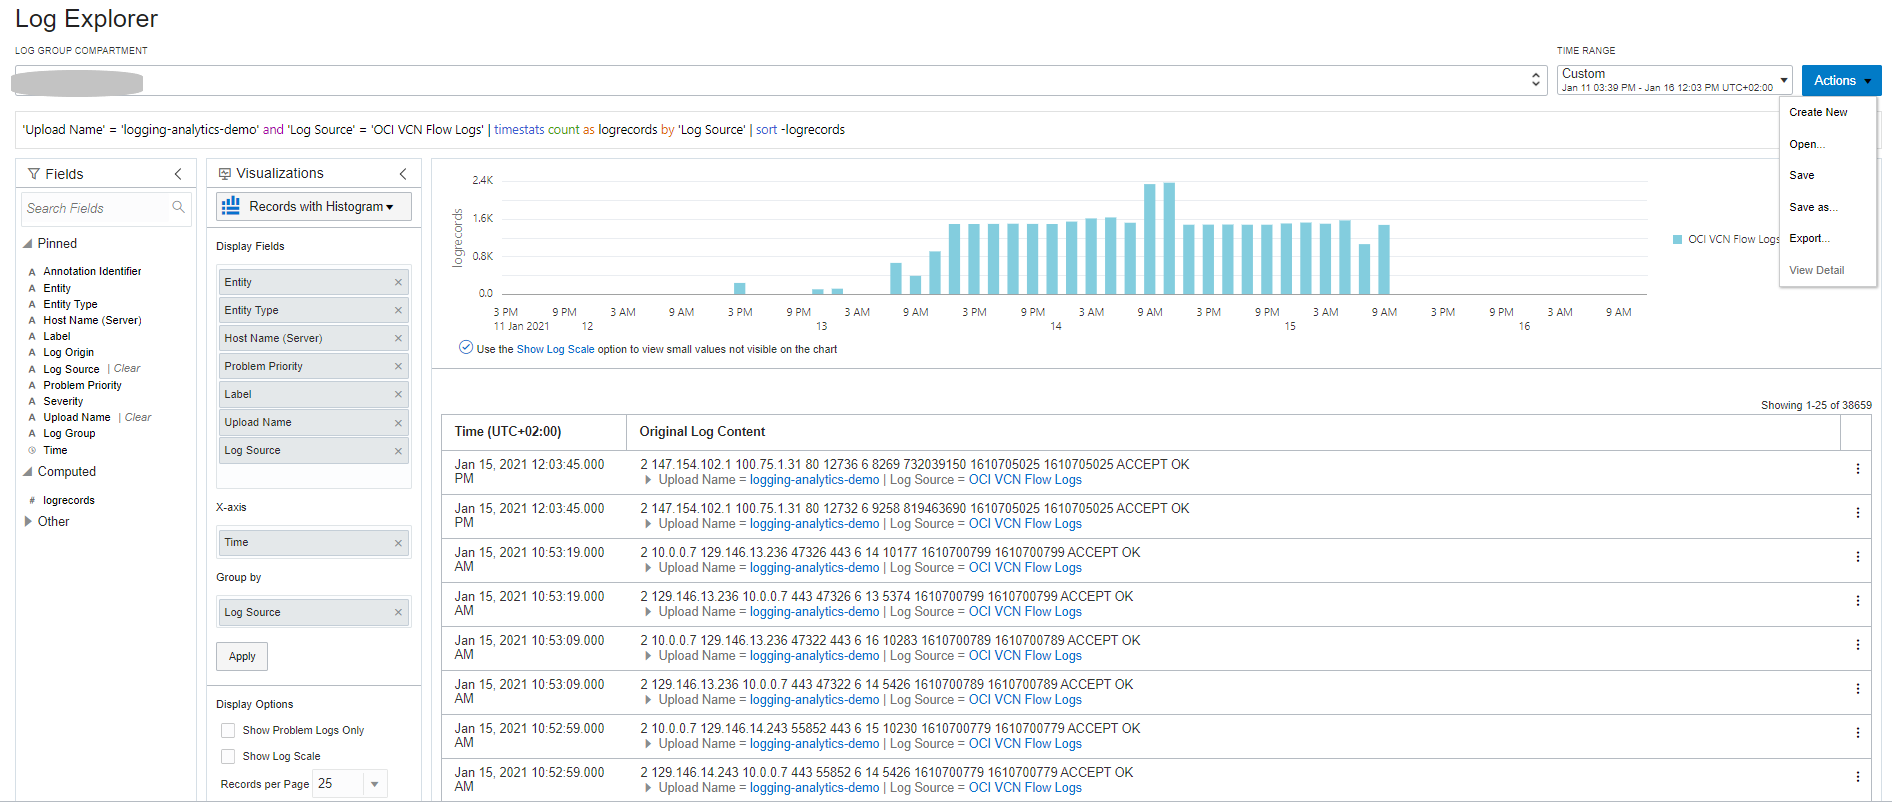
Navigate to Actions and click Save-As to save this search as a "Widget".
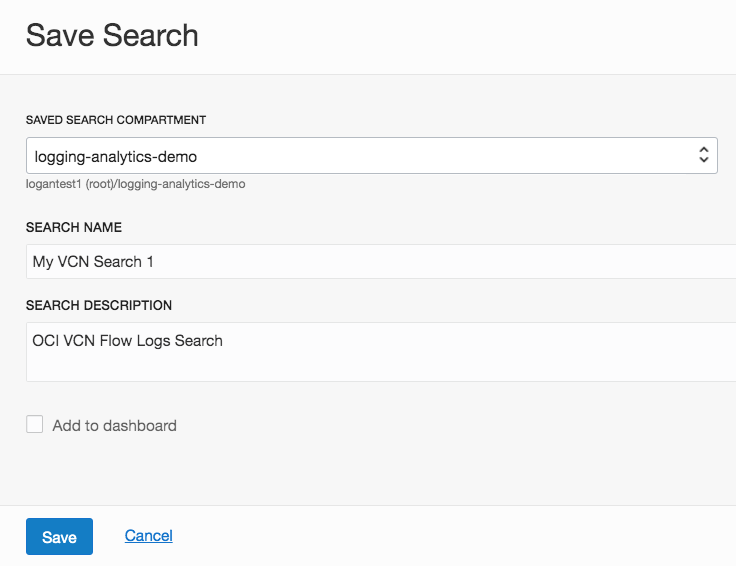
Complete the “Save Search” and click Save.
At this time the widget can be added to a dashboard directly from here, or later from the dashboard menu.
Create a couple of more widgets by viewing the various others logs.
You will later be adding them to a dashboard.
Return to viewing all your logs data.
Hint: Clear the query bar and click Run.
You are working with ~74k total records. It is easier to visualize large volume of data as related clusters. Logging Analytics - Clustering (Unsupervised ML) uses the log data and the enriched domain expertise to find patterns in the data. Clustering works on text as well as numbers, allowing large volume of data to be reduced to fewer patterns for anomaly detection. Click on the Cluster button in the visualization panel.
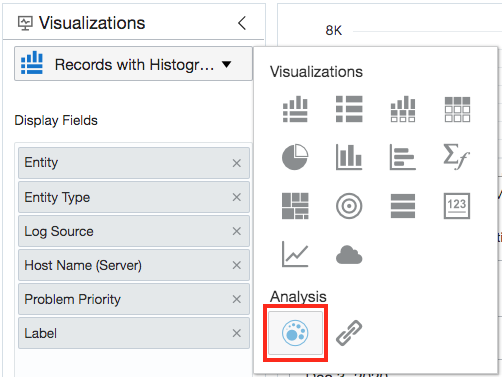
Drill down into different clusters, potential issues, outliers and trends.
Logging Analytics uses unsupervised ML to find related clusters in data. This reduces the ~74k logs to 629 cluster patterns, in real time.
Note: The numbers you see might be slightly different than the ones shown in the tutorial.
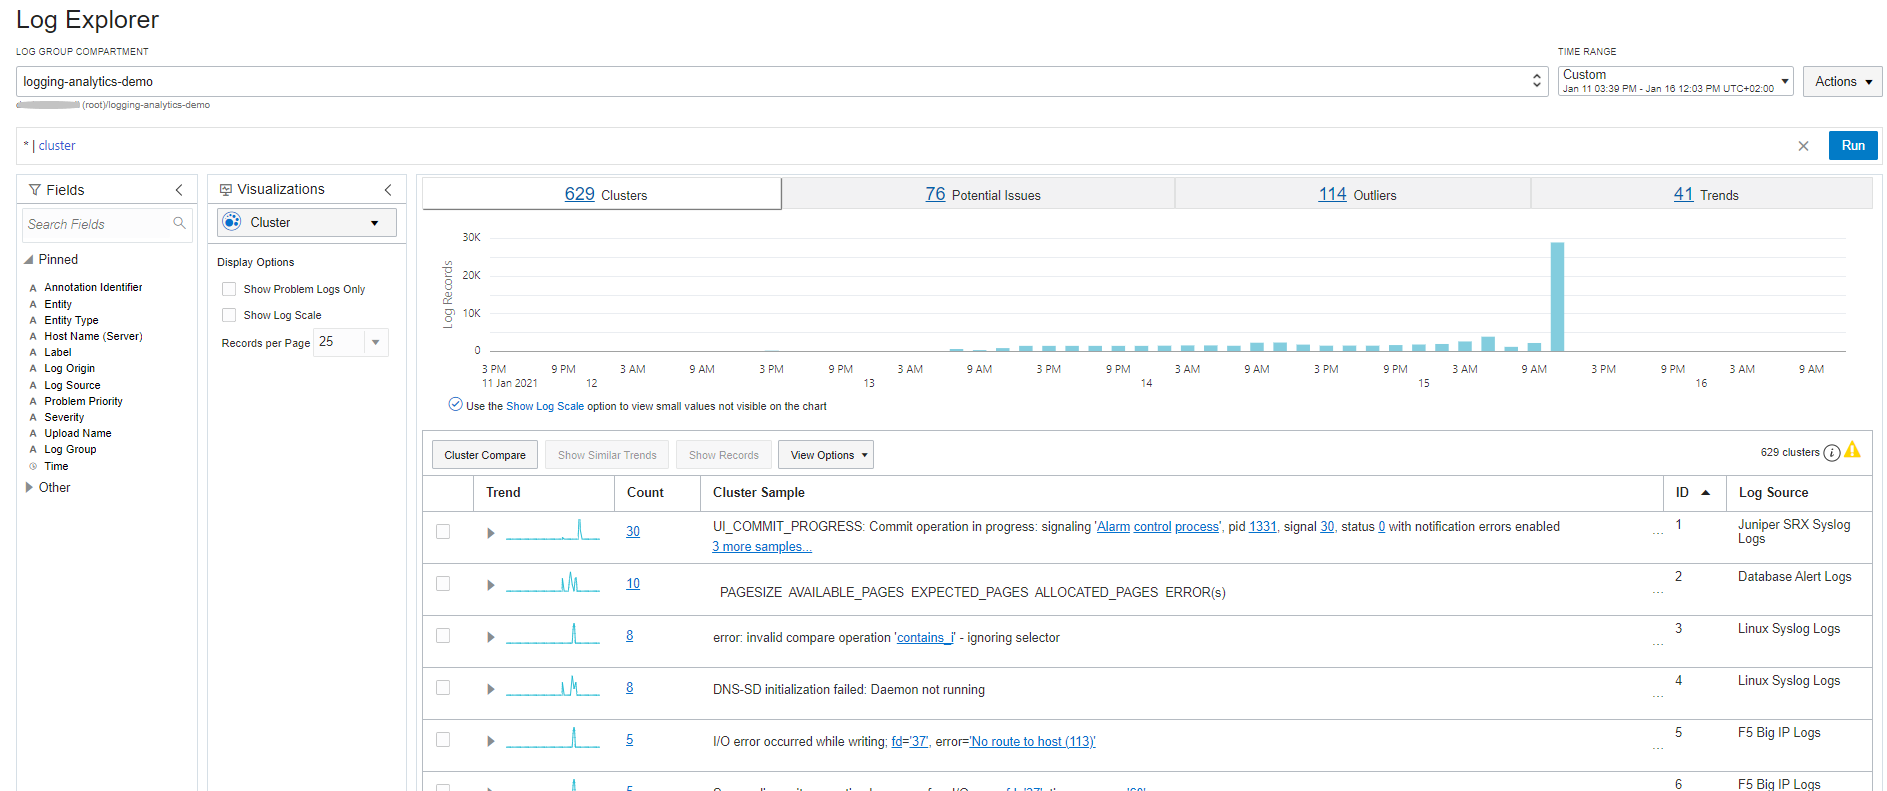
Click on the Potential Issues tab.
Out of the 629 clusters, 76 were automatically identified as Potential Issues.
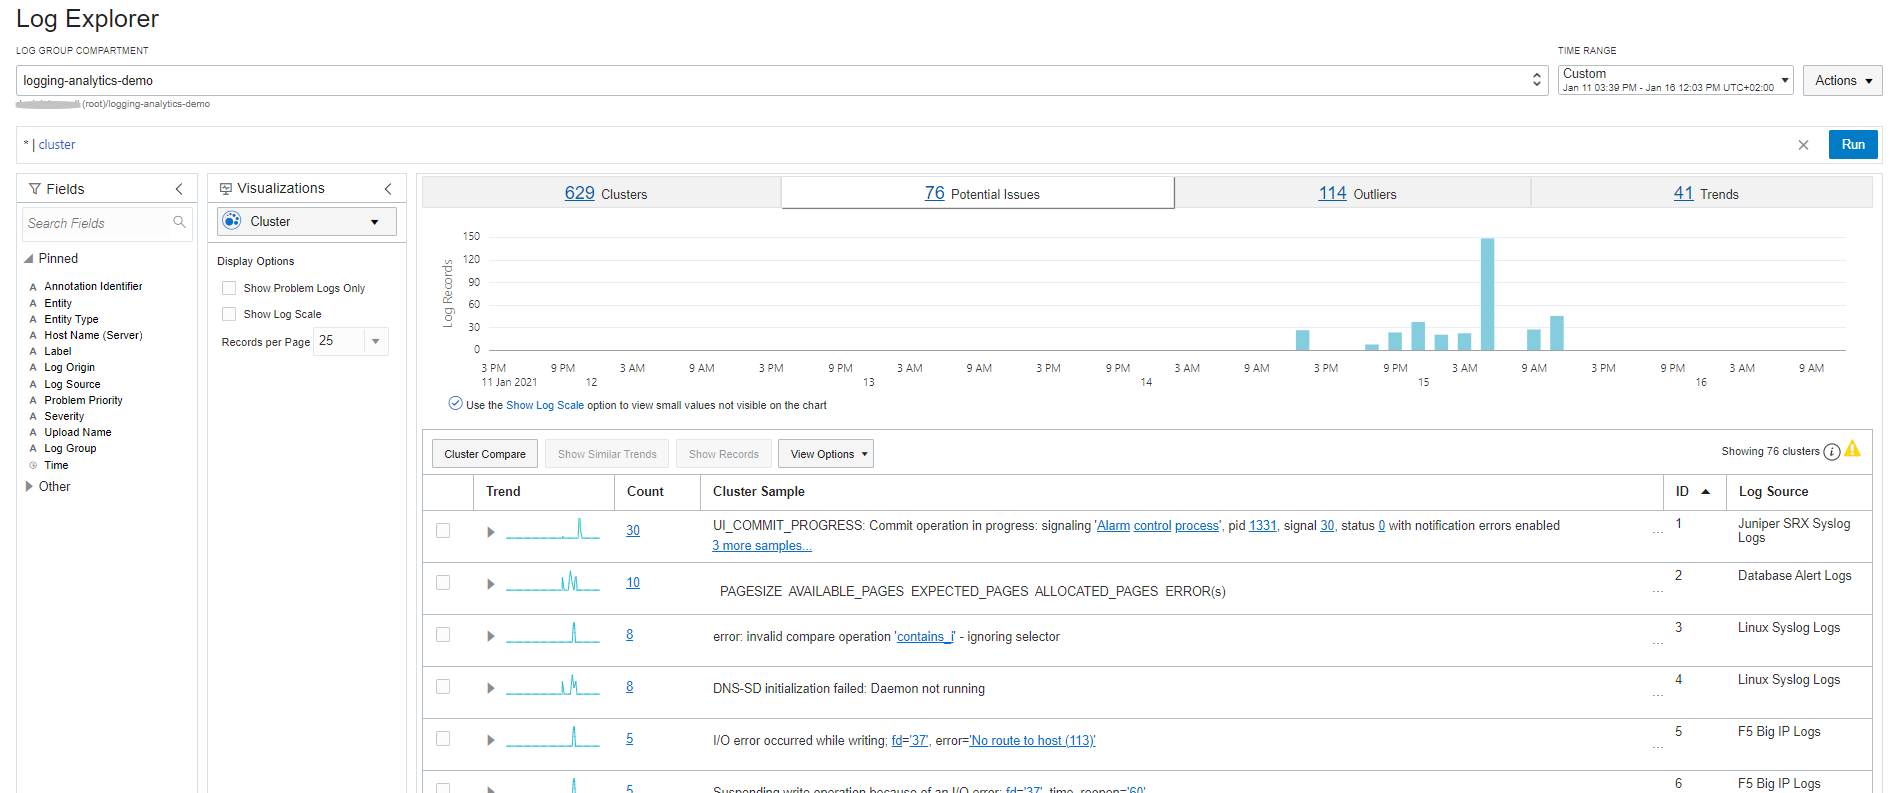
Click on Outliers tab.
These issues occurred only once, and indicate an anomaly in the system.
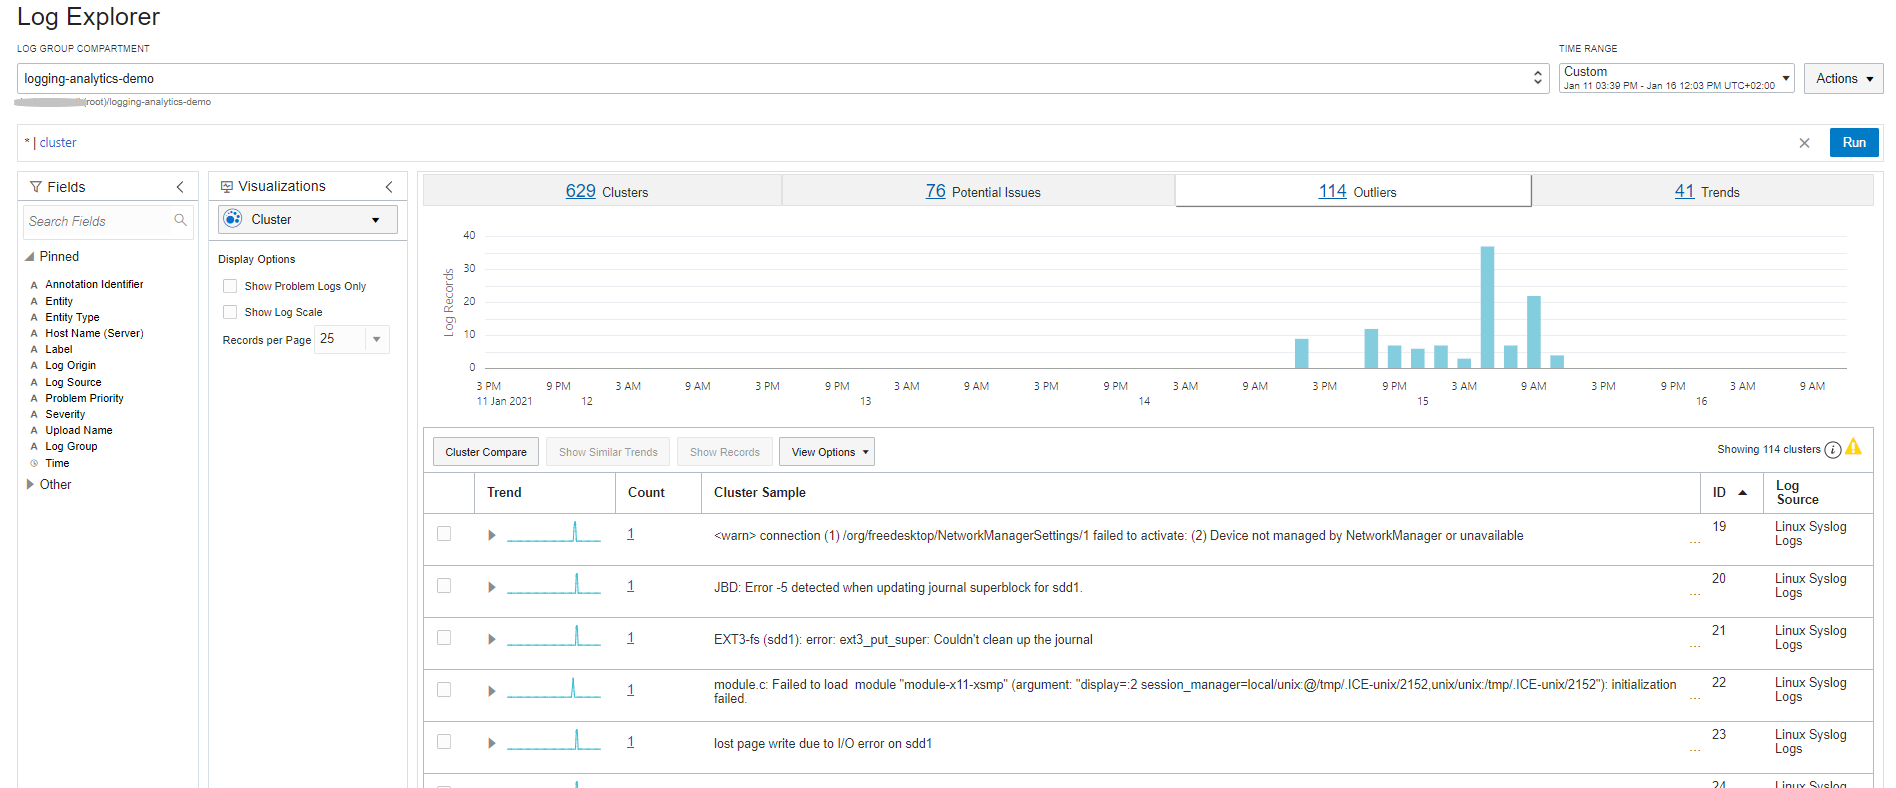
Now, click on Trends tab.
These are cluster patterns that are correlated in time. Click on 8 Similar Trends to see a set of related logs from the Database Alert Logs. Note that the exact number of displayed trends may vary based on the selected time window.
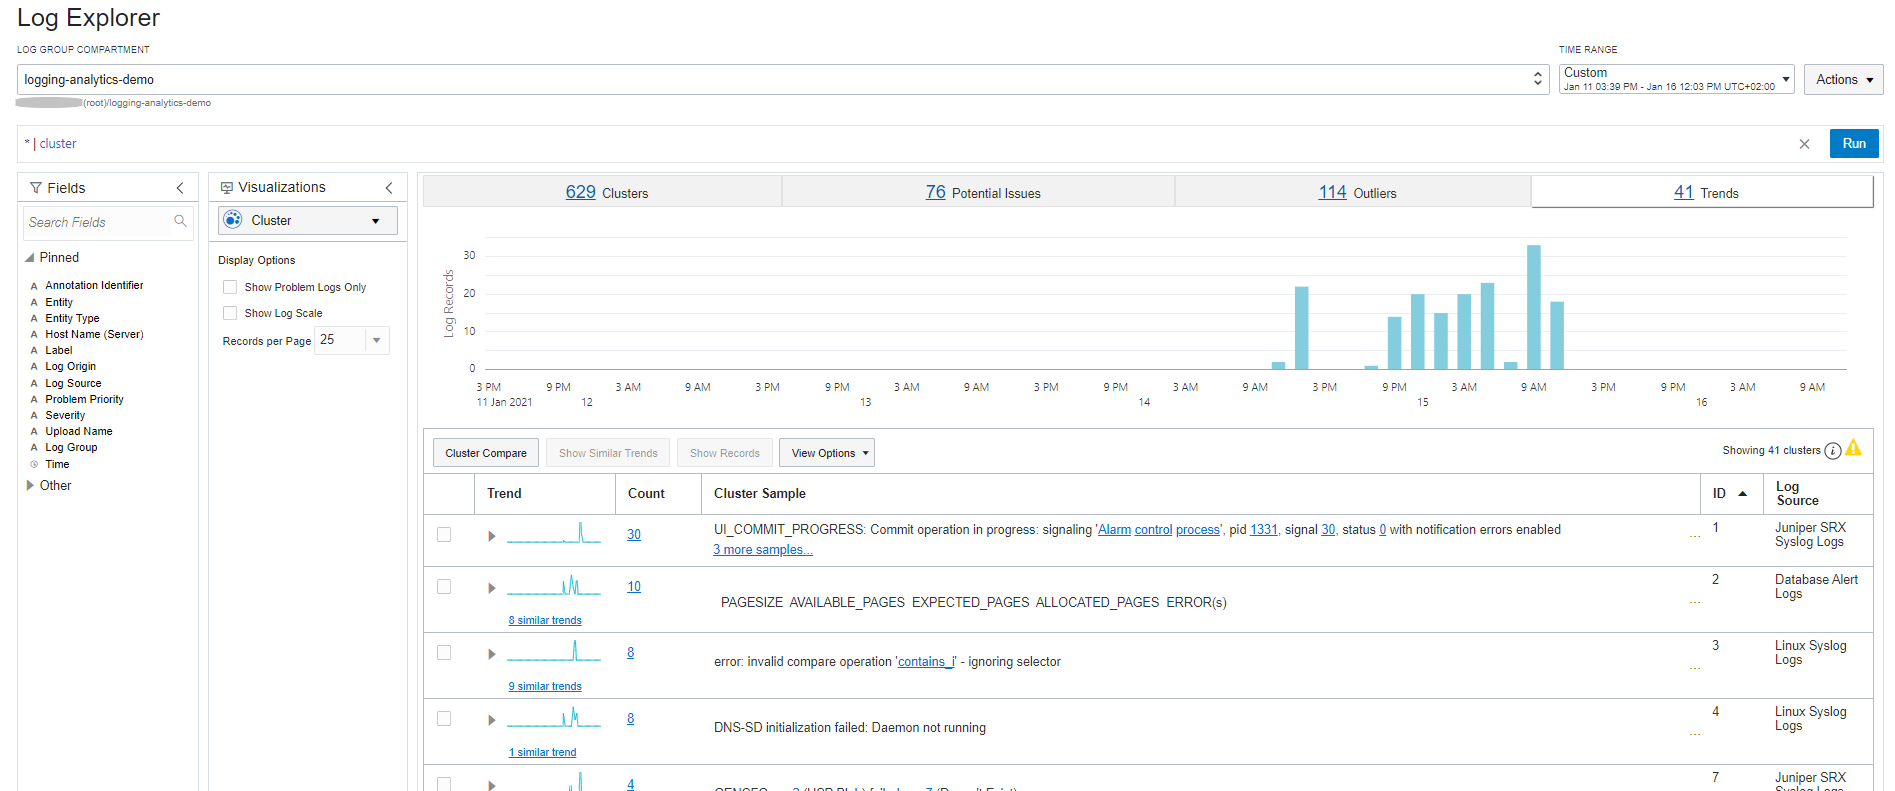
Save this search following the same steps you performed above in step 3.
Create one more visualization to understand the distribution of your network traffic.
First change visualization to Pie and select a new set of data,
OCI VCN Flow Logs.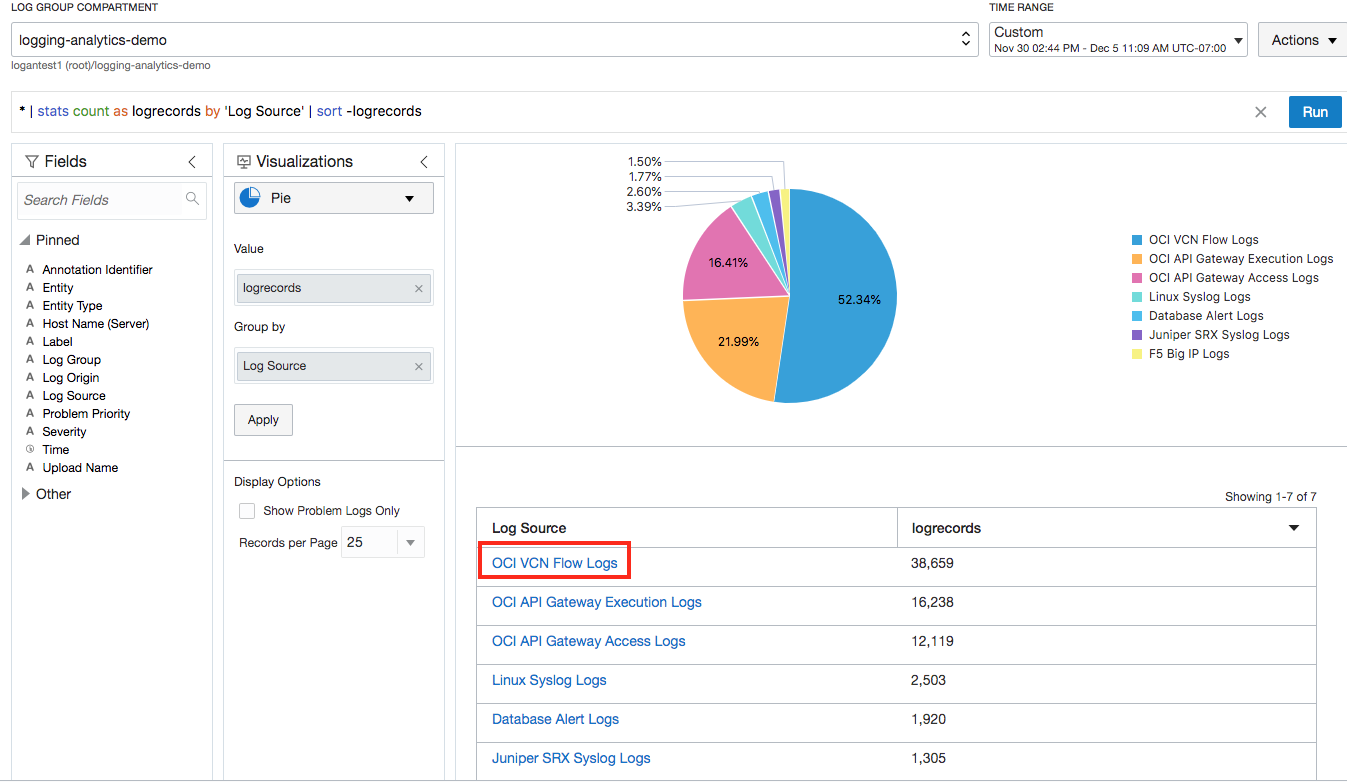
In the search box from the Fields Panel search for the string “Source”. Then, drag and drop “Source IP” from the ”Other” to the “Group by” box in the Visualization Panel and click Apply.
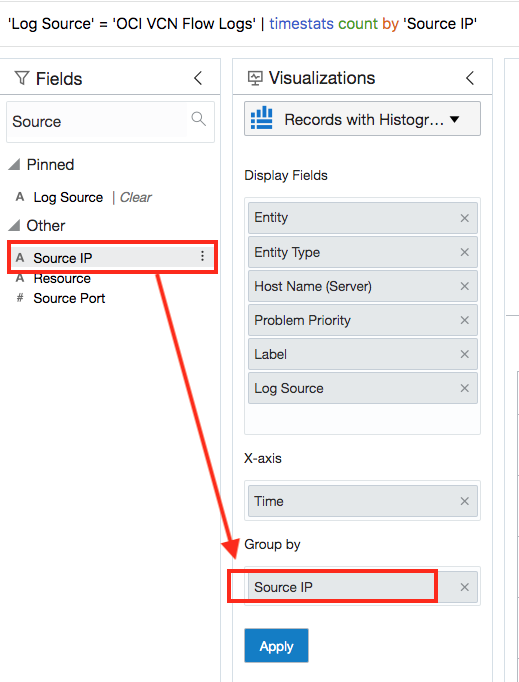
Here, you can see the log distribution by “Source IP”.

Find the distribution of "Destination IPs" using the query language.
Enter the following query in the query bar and click Run.
Hint: Anything copied outside the environment, to be pasted inside the environment, needs to be pasted in the Clipboard first, which is located in the action bar of the environment.
'Log Source' = 'OCI VCN Flow Logs’ | stats count('Destination IP') by 'Destination IP'
A Pie chart (as set by default) with records is shown.

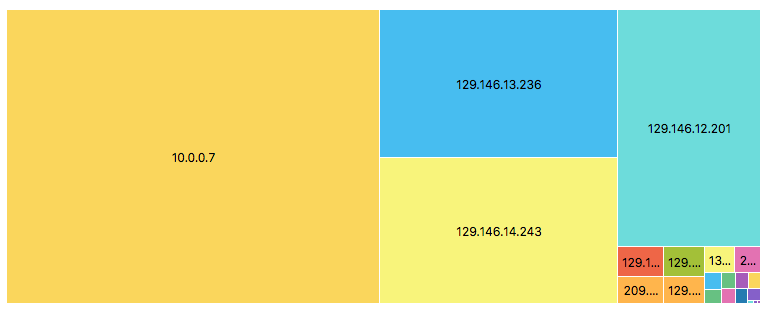
Change the visualization to a tree map by selecting "Tree map" from the visualization menu.
Select “Tree map” from the visualization menu.
On this page you can visualize the Destination-IPs distribution. Save As this search/widget.
Explore Logs Using "Link"
Correlate data with other data sources using the unsupervised Link feature. Enter the following in the query bar, and click Run. Navigate to Administration, and under Resources click Uploads. Select and copy (Ctrl-C) the name of the upload. Navigate back to Log Explorer and replace in the query bar
logging-analytics-demowith the upload name you have copied (selectlogging-analytics-demoand press Ctrl-V), then click Run.Hint: Press Ctrl-I in the query bar to format the query.
'Upload Name' = 'logging-analytics-demo' and 'Log Source' = 'OCI VCN Flow Logs'
| eval 'Source Name' = if('Source Port' = 80,
                       HTTP,
                       'Source Port' = 443,
                       HTTPS,
                       'Source Port' = 21,
                       FTP,
                       'Source Port' = 22,
                       SSH,
                       'Source Port' = 137,
                       NetBIOS,
                       'Source Port' = 648,
                       RRP,
                       'Source Port' = 9006,
                       Tomcat,
                       'Source Port' = 9042,
                       Cassandra,
                       'Source Port' = 9060,
                       'Websphere Admin. Console',
                       'Source Port' = 9100,
                       'Network  Printer',
                       'Source Port' = 9200,
                       'Elastic Search',
                       Other)
 | eval 'Destination Name' = if('Destination Port' = 80,
                            HTTP,
                            'Destination Port' = 443,
                            HTTPS,
                            'Destination Port' = 21,
                            SSH,
                            'Destination Port' = 22,
                            FTP,
                            'Destination Port' = 137,
                            NetBIOS,
                            'Destination Port' = 648,
                            RRP,
                            'Destination Port' = 9006,
                            Tomcat,
                            'Destination Port' = 9042,
                            Cassandra,
                            'Destination Port' = 9060,
                            'Websphere Admin. Console',
                            'Destination Port' = 9100,
                            'Network  Printer',
                            'Destination Port' = 9200,
                            'Elastic Search',
                            Other)
 | eval Source = 'Source IP' || ':' || 'Source Port'
 | eval Destination = 'Destination IP' || ':' || 'Destination Port'
 | link Source,
    Destination
 | stats avg('Content Size Out') as 'Transfer Size (bytes)',
    unique('Source Name') as 'Traffic From',
    unique('Destination Name') as 'Traffic To'
 | classify topcount = 300 correlate = -*,
    Source,
    Destination 'Start Time',
    'Traffic From',
    'Transfer Size (bytes)',
    'Traffic To' as Network
The eval functionality translates the Port names to Applications.
The last part of the query adds more query time evaluation fields, which create a unique row for each Source and Destination, and compute the average network transfer between these end points. In addition, you also get a translated name for the Source and Destination ports as ‘Traffic From’ and ‘Traffic To’.
Navigate to Analyze, click Create Chart and fill in the fields as shown below:
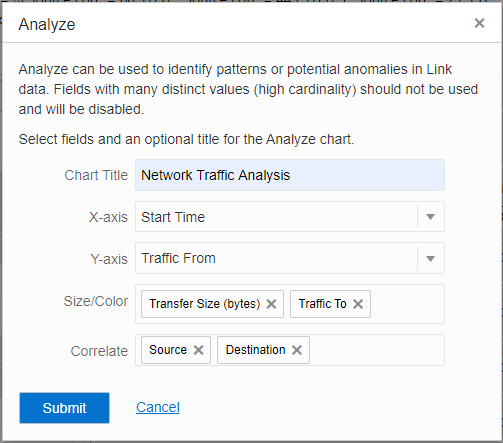
Analyze clusters and analyzes the specified data points, creating the below analysis:

You can chose different fields to control the size and colors of the items on the chart.

Hover over items to see detail information about them.

You can click on items to have access to its contents.
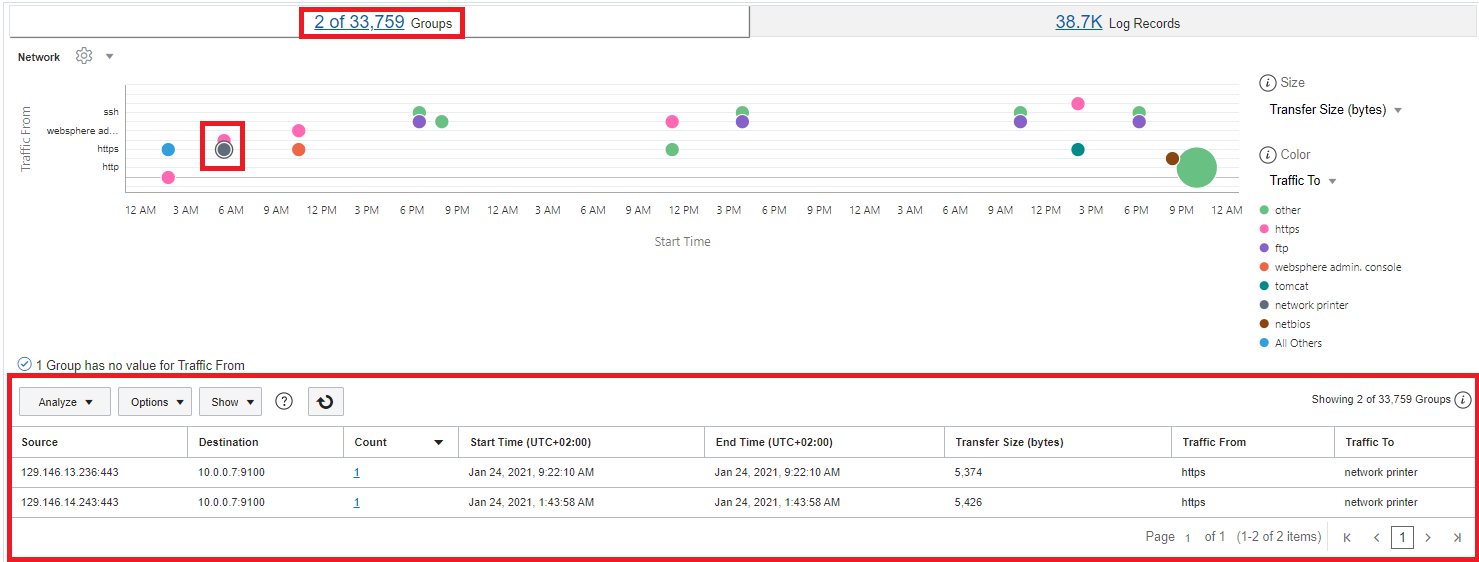
Save this as a widget.
Navigate to Options and click Display Options. In the 'Dashboard Options' section of the panel, uncheck all options, and check only 'Analyze' and 'Data Table'. Click Save Changes. Then, navigate to Actions and click Save As to save this analysis as a widget.
Create Dashboards
Navigate to Logging Analytics and click Dashboards.
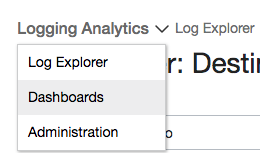
Click Create.
Enter a dashboard name, the compartment previously created (logging-analytics-demo) and use the saved searches available as widgets for the dashboard on the right side. Drag and drop a widget on the canvas. The panels can be sized and moved on the canvas. Add other widgets created earlier. You dashboard may look something like this:

Learn More
To continuously collect log data from your on-premises entities, you can install Management Agents on your hosts, on-premises or in a cloud infrastructure. See details under Use Oracle Management Agents .
For more info on Entity Associations used to create relationships, see:
Configure New Source-Entity Association
Entity Types Modeled in Logging Analytics
For other technical information, see Logging Analytics .
Explore other labs on Oracle Learn or access more free learning content on the Oracle Learning YouTube channel . Additionally, visit Oracle University to become an Oracle Learning Explorer.